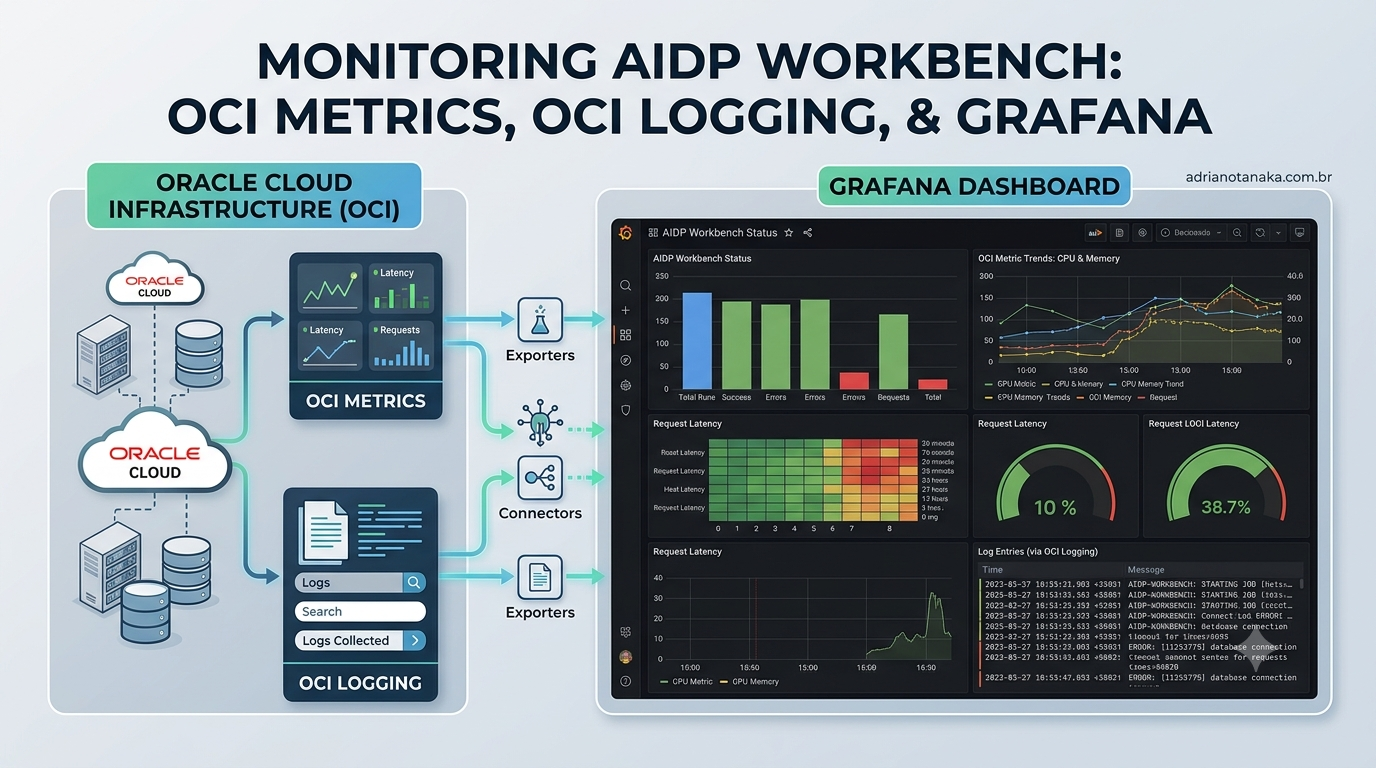
Monitoring AIDP Workbench with OCI Metrics, OCI Logging, and Grafana
A practical guide for building Grafana dashboards that combine AIDP Workbench metrics and job-run audit logs from Oracle Cloud Infrastructure.
Overview
Oracle AI Data Platform Workbench (AIDP Workbench) is a governed workspace for building, managing, and operationalizing enterprise data and AI workflows. For operations teams, the key requirement is visibility: cluster utilization, job status, and errors must be easy to inspect without switching between multiple consoles.
This guide shows how to monitor AIDP Workbench in Grafana by using two Oracle-provided data sources: OCI Metrics for time-series service metrics and OCI Logs for job-run events from OCI Logging and Audit.
Core services
AIDP Workbench: the Oracle workspace where teams prepare data, run jobs, and manage AI/data workflows.
OCI Metrics: the Monitoring service data model for time-series metrics such as CPU utilization, memory utilization, throughput, latency, and service-specific custom metrics.
OCI Metrics and OCI Logs Grafana plugins: Oracle-provided Grafana data source plugins that let Grafana query OCI Monitoring and OCI Logging directly, while continuing to use OCI IAM for access control.
Before you start
Make sure Grafana has network access to OCI APIs and an OCI principal with permission to inspect compartments, read metrics, and read log content in the AIDP compartment. If Grafana runs on an OCI Compute instance, use instance-principal authentication with a dynamic group and policy instead of storing user credentials.
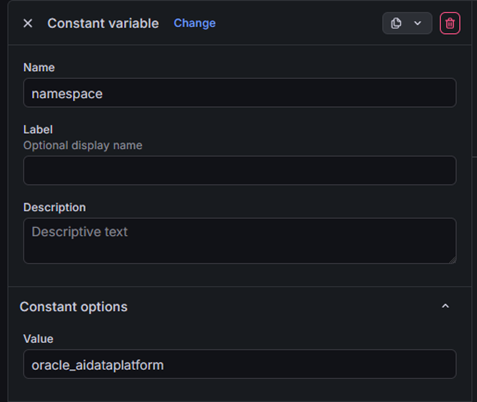
AIDP Workbench metrics are published under the `oracle_aidataplatform` namespace. If the dashboard is dedicated to AIDP Workbench, you can make the namespace a static variable with that value.
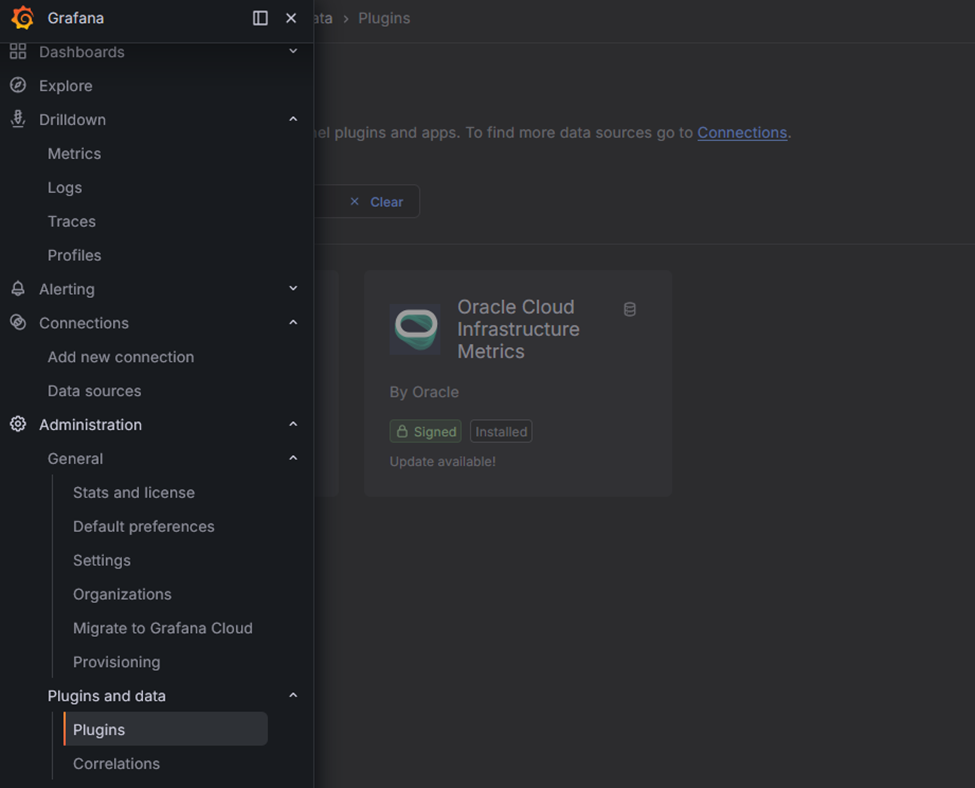
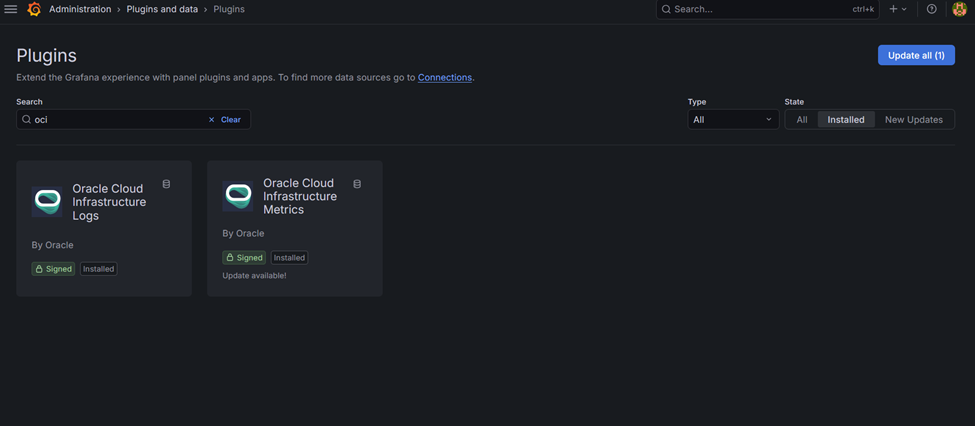
Install the OCI Grafana data sources
In Grafana, open Plugins and install both Oracle Cloud Infrastructure Metrics and Oracle Cloud Infrastructure Logs. Then create one data source for each plugin.
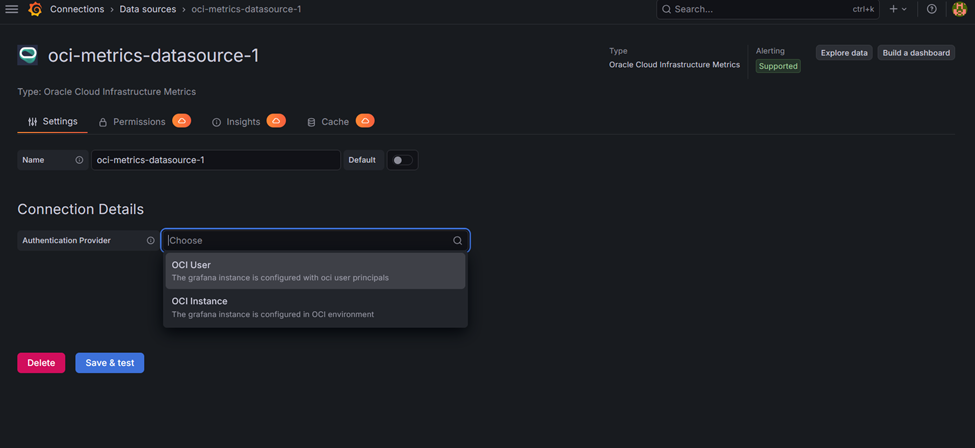
When Grafana runs inside OCI, configure the data sources to use instance-principal authentication. This keeps the dashboard service accountable through IAM policy and avoids long-lived personal API keys.
Create dashboard variables
Create query-type variables in the Grafana dashboard so one dashboard can work across regions, compartments, namespaces, resource groups, metrics, and dimensions.
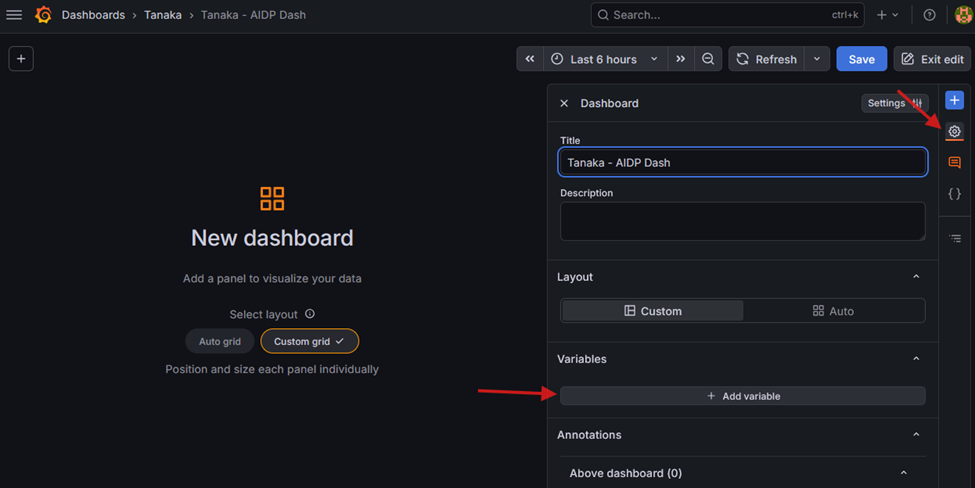
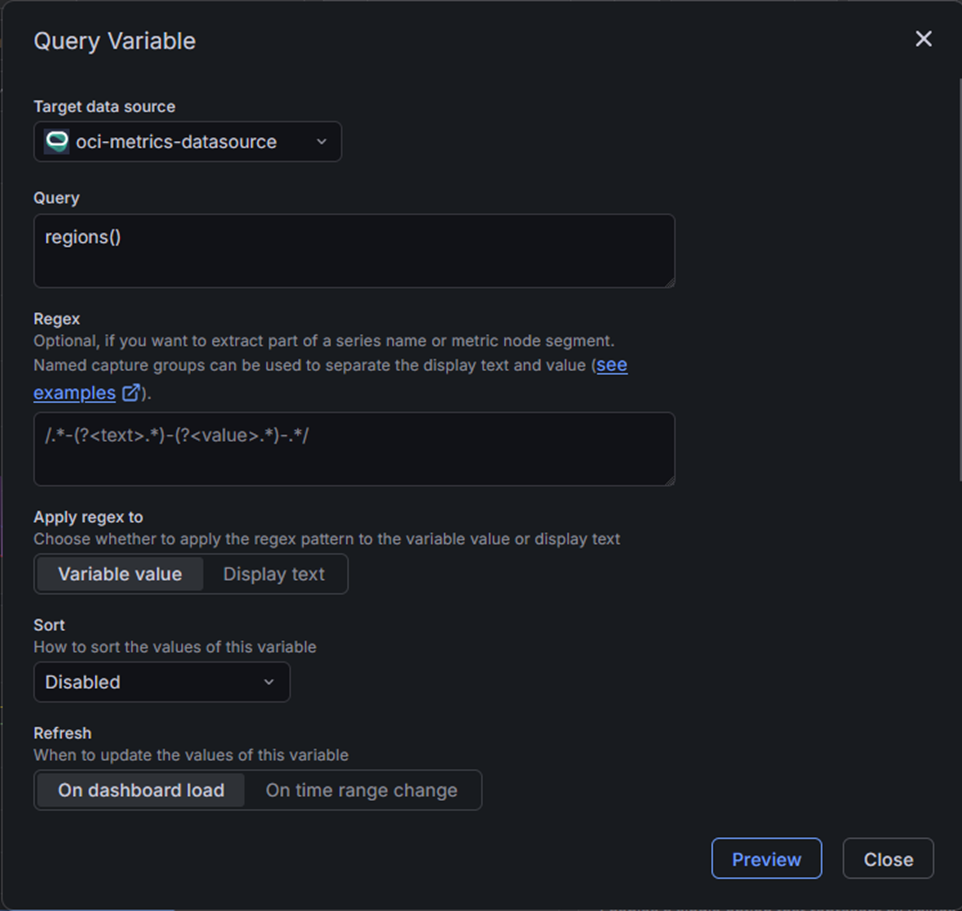
Use the OCI Metrics data source for these variables. The variable functions below are supported by the OCI Metrics plugin and make the dashboard easier to reuse.
| Variable | Query |
| region | regions() |
| compartment | compartments() |
| namespace | namespaces($region, $compartment) |
| resourcegroup | resourcegroups($region, $compartment, $namespace) |
| metric | metrics($region, $compartment, $namespace, $resourcegroup) |
| dimension | dimensions($region, $compartment, $namespace, $metric, $resourcegroup) |
For an AIDP-only dashboard, change the namespace variable to a constant value and set it to oracle_aidataplatform.
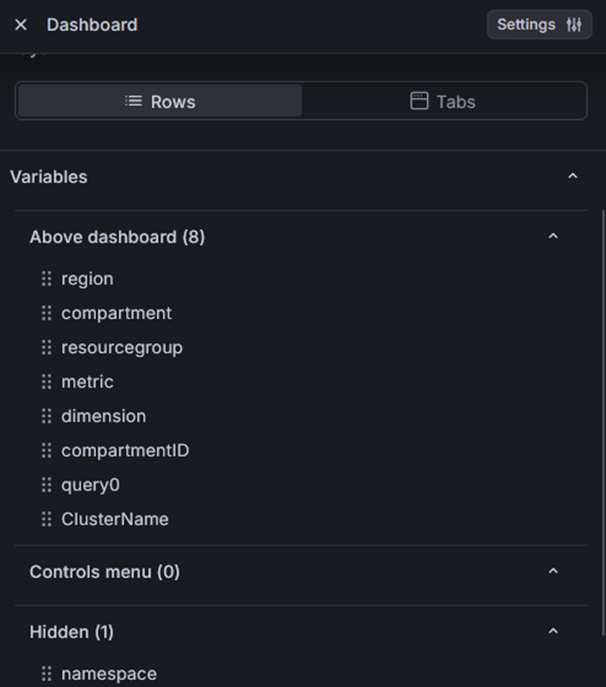
After the variables are created, the dashboard should provide a clean set of filters for region, compartment, namespace, metric, and dimension selection.
Build AIDP compute-cluster metric panels
Create a row for compute-cluster metrics and another row for job statistics. For the compute row, select the OCI Metrics data source, then use $region, $compartment, and $namespace so the panel follows the dashboard filters.
Start with CpuUtilization, aggregate by average, and use a one-minute interval. This provides a near-real-time view of driver and executor behavior for the selected AIDP cluster.
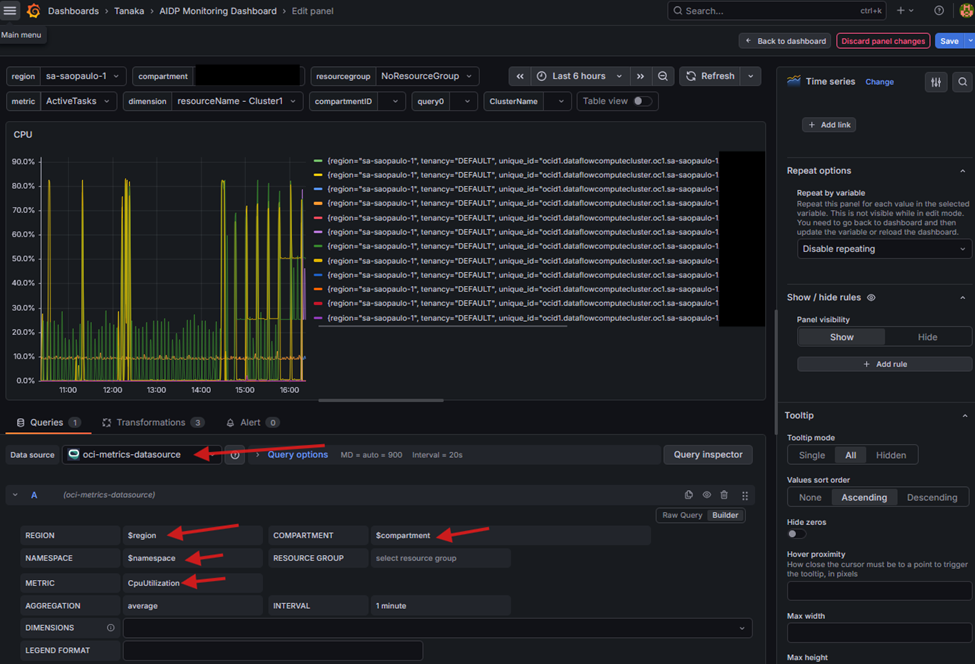
Use a legend format and transformations to make executor labels readable.
Legend format: Cluster: {{resourceName}} - Executor: {{executorId}}Transform the raw executor labels so the driver and executors are easier to scan in the chart legend.
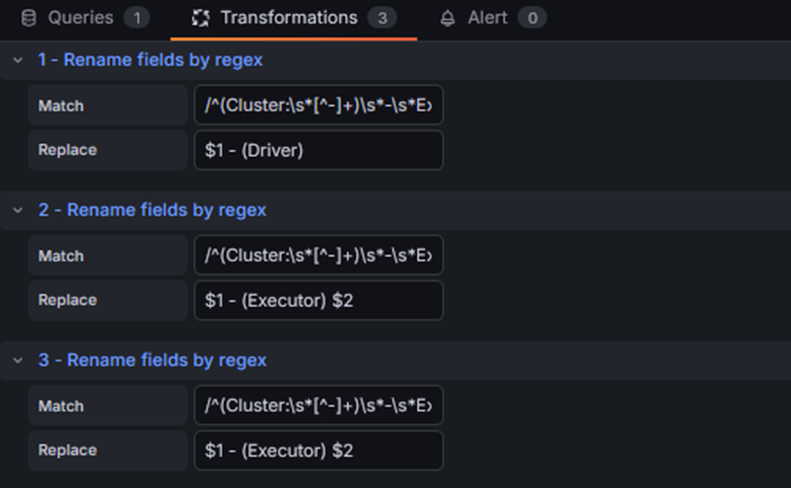
Match: /^(Cluster:\s*[^-]+)\s*-\s*Executor:\s*1\s+1$/
Replace: $1 - (Driver)
Match: /^(Cluster:\s*[^-]+)\s*-\s*Executor:\s*1\s+([2-9]\d*)$/
Replace: $1 - (Executor) $2Match: /^(Cluster:\s*[^-]+)\s*-\s*Executor:\s*1\s+(\d+)$/
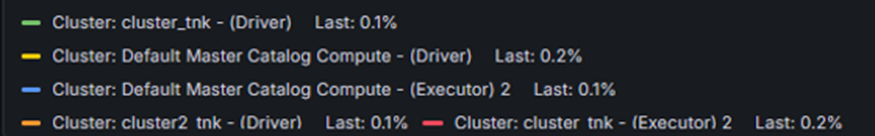
Replace: $1 - (Executor) $2With these transformations, the panel shows the cluster name and whether each time series represents the driver or an executor.
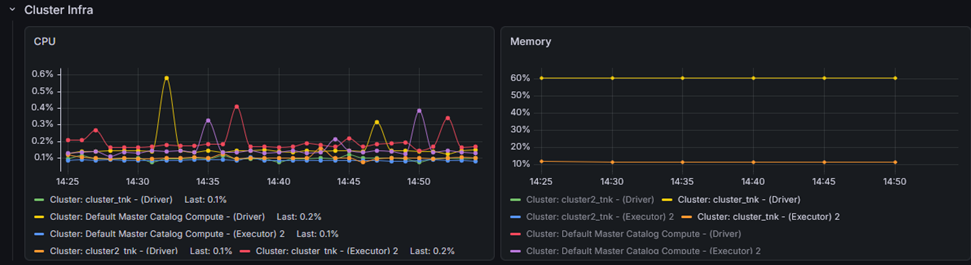
Repeat the same pattern for MemoryUtilization so the dashboard can show CPU and memory pressure side by side.
Add job-status panels from OCI Logging
For job status, use the OCI Logs data source. Create a panel that searches the AIDP compartment Audit log for completed job runs.
Failed jobs query:
search "ocid1.compartment.oc1..YOUR_AIDP_COMPARTMENT_OCID/_Audit" | where type='com.oraclecloud.datalake.CreateJobRun.end' and data.additionalDetails.jobStatus contains_ci 'failed' | sort by datetime descSuccessful jobs query:
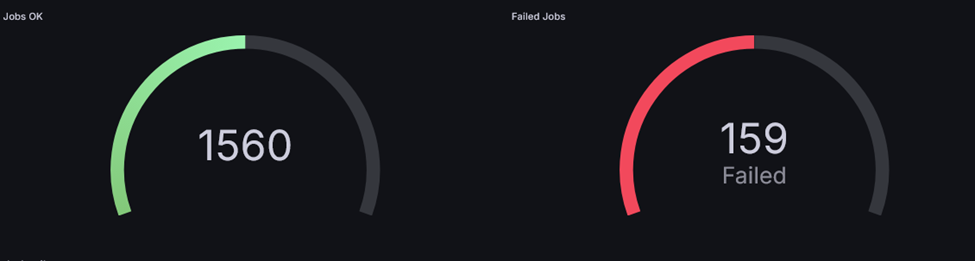
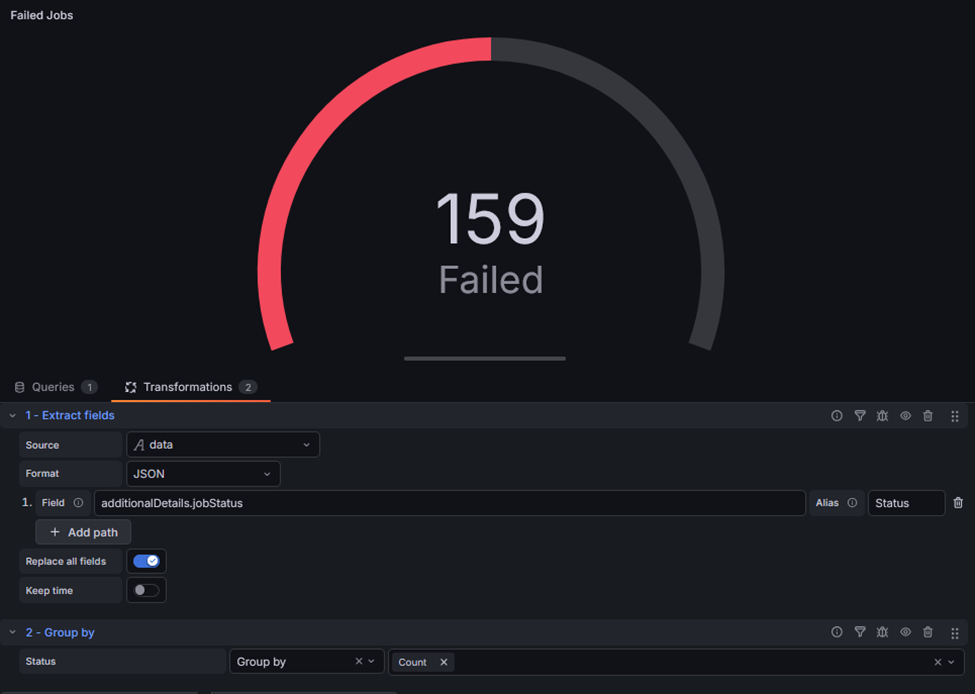
search "ocid1.compartment.oc1..YOUR_AIDP_COMPARTMENT_OCID/_Audit" | where type='com.oraclecloud.datalake.CreateJobRun.end' and data.additionalDetails.jobStatus contains_ci 'success' | sort by datetime descUse a Gauge visualization for a simple status indicator. For the failed-jobs panel, set the base threshold to red, so failures stand out immediately.
Apply transformations to shape the log query output into the fields you want to display.
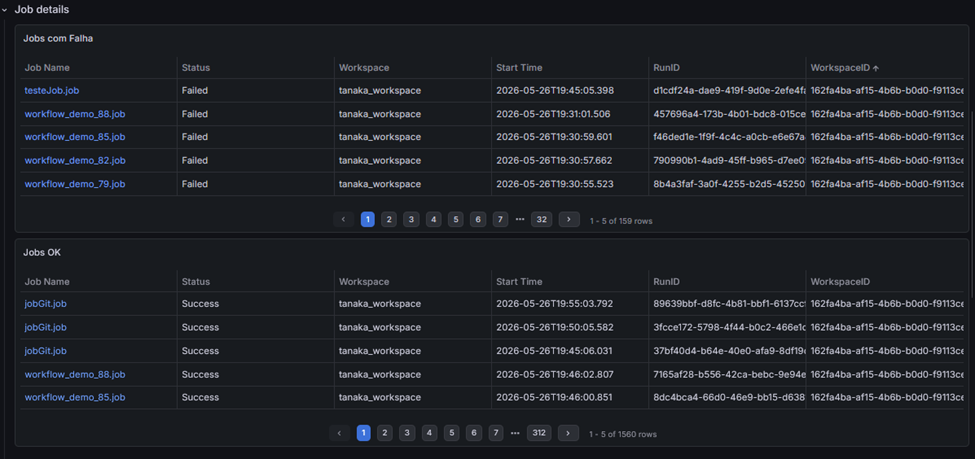
Create an interactive job table
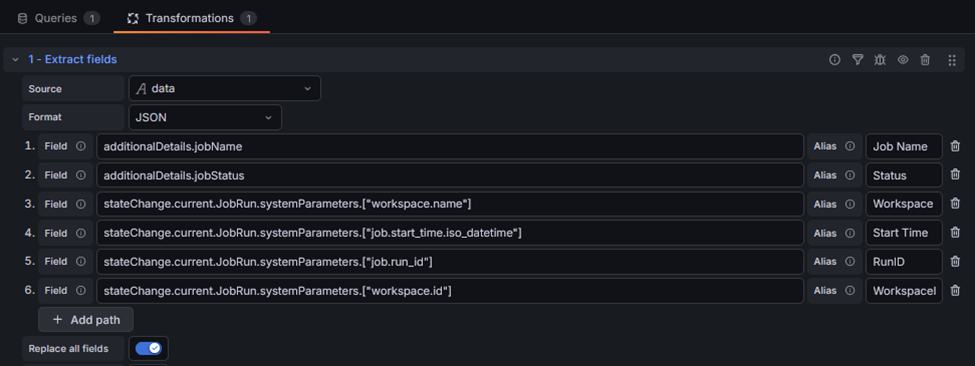
Use the same log query with a Table visualization to create a drill-down view of job runs. Parse the JSON fields you need, such as job name, job run ID, status, start time, and workflow identifiers.
Add a Grafana data link that builds the AIDP Workbench workflow URL from the parsed fields. Use your AIDP Workbench URL and tenancy-specific path values.
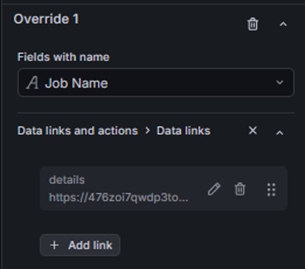
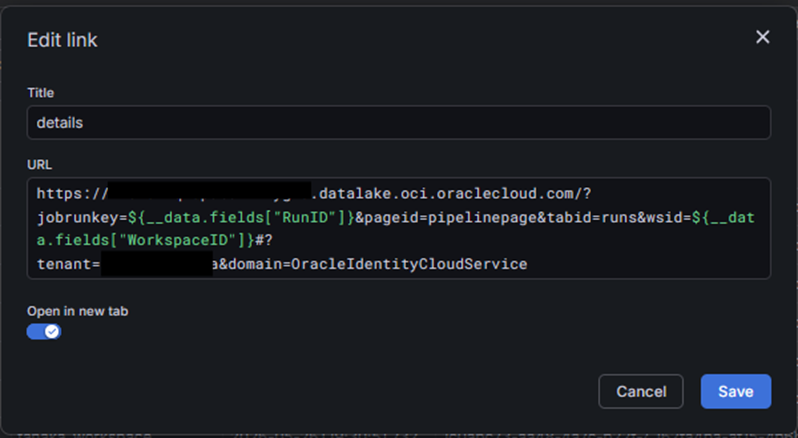
The result is an operational table where users can click a job name and open the corresponding AIDP workflow page directly from Grafana.
Operational notes
Keep the dashboard reusable by relying on variables for region, compartment, namespace, and metric selection. Keep the AIDP namespace static only when the dashboard is intentionally scoped to AIDP Workbench.
For production dashboards, use OCI IAM groups, dynamic groups, and least-privilege policies so Grafana can read only the metrics and logs required by the dashboard. Review both the metric panels and log queries after AIDP Workbench upgrades, because new metrics or log fields may become available.
References
Oracle AI Data Platform Workbench documentation: https://docs.oracle.com/en/cloud/paas/ai-data-platform/
OCI Metrics Grafana plugin: https://grafana.com/grafana/plugins/oci-metrics-datasource/
OCI Logs Grafana plugin: https://grafana.com/grafana/plugins/oci-logs-datasource/